How Can You Tell Street-Lighting Stories That Win With the Right KPIs?
Featured image:
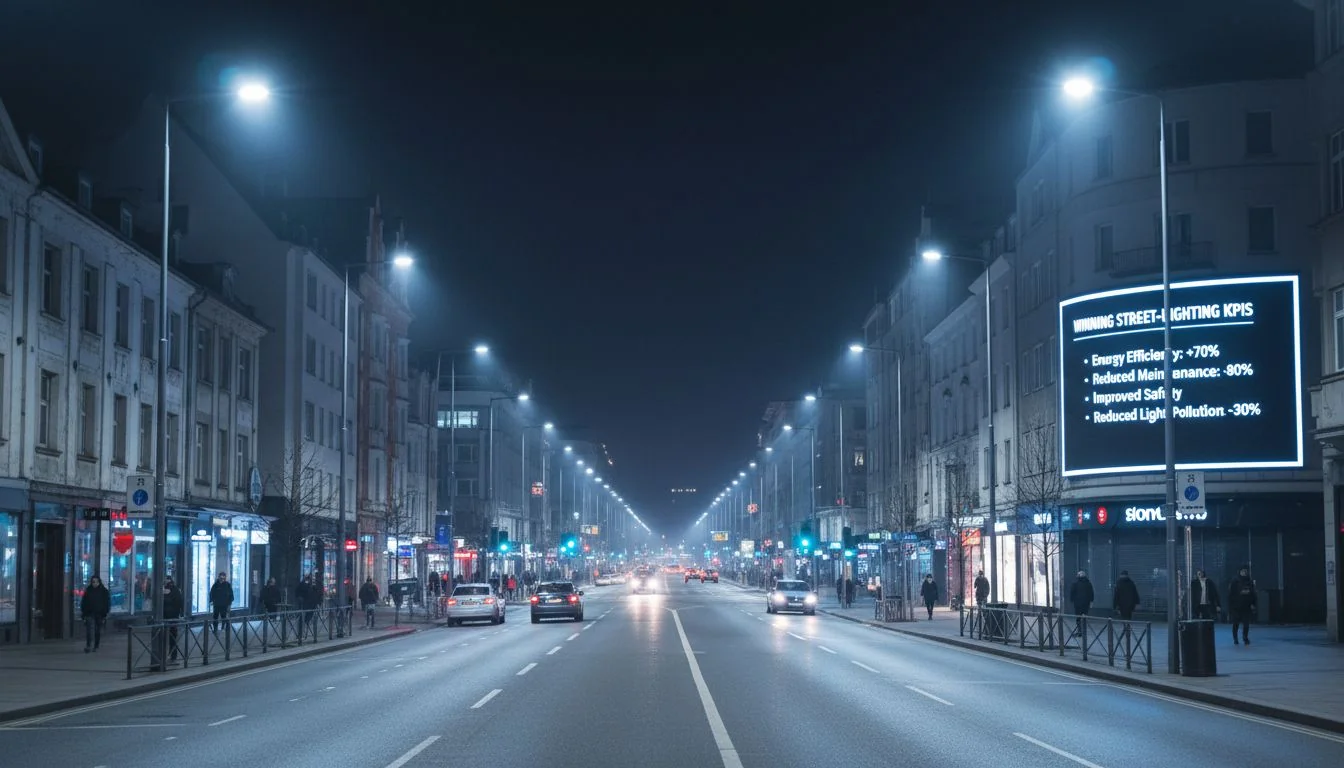
Your streetlight project proposals get lost in budget debates. You struggle to prove the real return on investment beyond just saying "it's brighter." The solution is using hard data.
To win support, focus your story on three core areas. First, verifiable energy savings1 measured in kWh and cost. Second, measurable safety improvements using luminance and crash data. Third, operational efficiency proven by complaint resolution rates and Mean Time To Repair (MTTR).
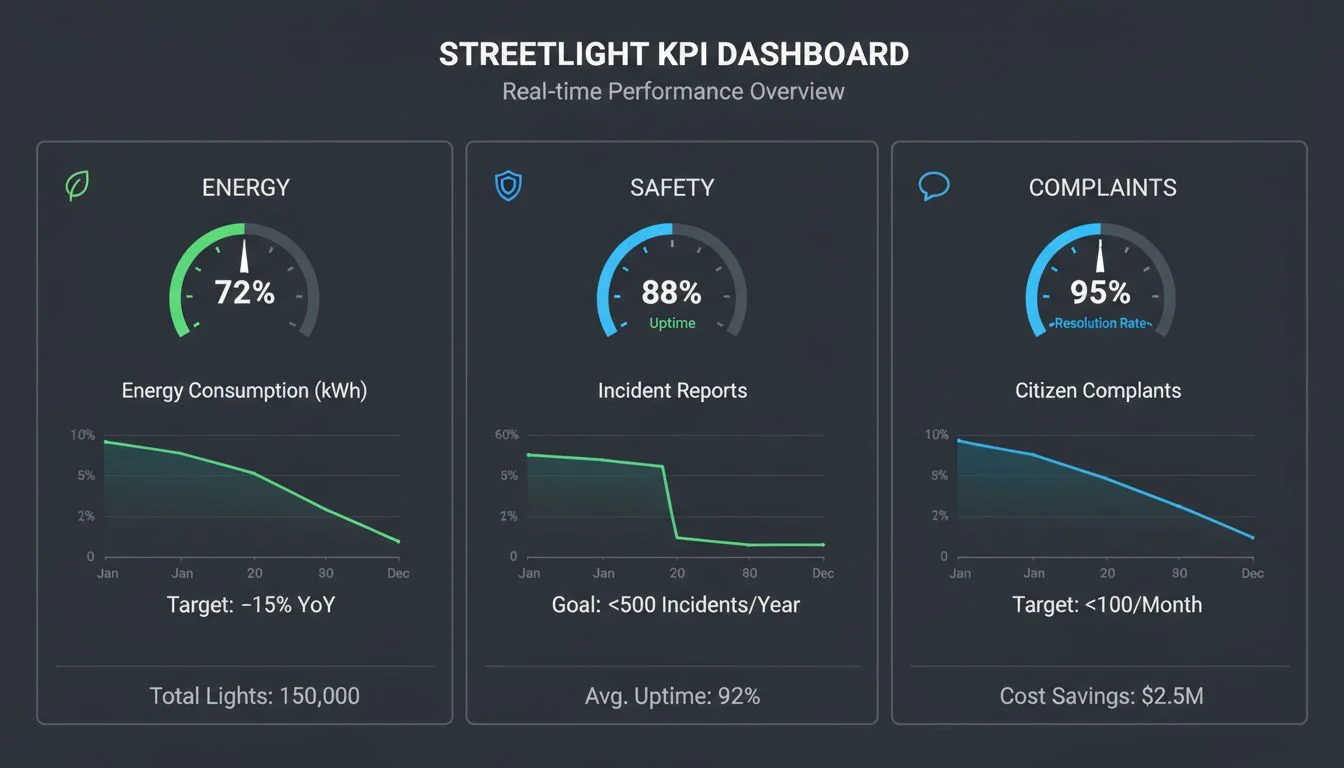
For over 13 years, I've helped contractors and developers justify major lighting projects. The secret isn't just having a great product; it's about presenting a great business case. You have to speak the language of finance, safety, and public works officials. They want to see numbers that prove value, not just hear promises. This guide breaks down the exact KPIs you need to build an undeniable story that gets your project approved. Let's dive into the data that matters.
LED streetlights can reduce a city's energy consumption by up to 85% when combined with smart controls.True
According to the U.S. Department of Energy, LED conversions alone can save 50%, and adaptive controls can add another 30-35% in savings.
Simply making a street brighter automatically reduces crime rates by 50%.False
While improved lighting is correlated with crime reduction, the effect is typically in the 10-20% range and is highly dependent on other factors. 'Brighter' can also create glare, which reduces visibility.
How Do You Prove Energy Savings That Actually Show Up on the Bill?
Your proposal promised huge energy savings, but the utility bill tells a different story. Now, stakeholders are skeptical of your claims. The solution is to focus on three concrete KPIs.
To prove savings, you must track three things. First, the reduction in kilowatt-hour (kWh) consumption. Second, the verified cost per kWh. Third, the total dollar savings. Always compare this against a baseline with photometrically equivalent lighting to ensure your claims survive scrutiny.
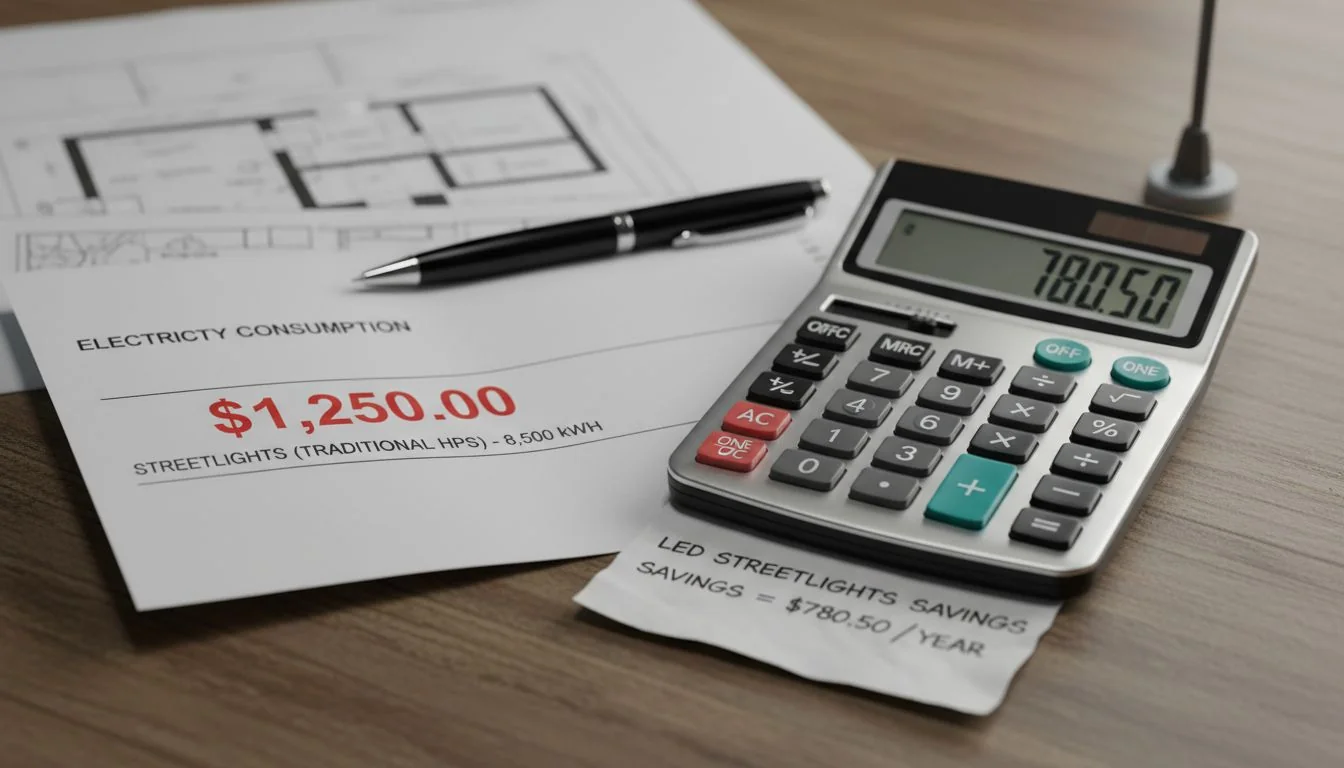
In my experience, the quickest way to lose credibility is to make a savings claim that doesn't hold up. I once saw a project fail because the team compared a new 150W LED to an old 400W High-Pressure Sodium (HPS) lamp without proving the light output was the same. The finance department saw it as an apples-to-oranges comparison. You must prove you are delivering the same or better service for less energy. This is where photometric equivalence2 becomes your most powerful argument. It’s not just about saving energy; it’s about proving you did it without compromising on the quality of light.
The Baseline KPI: kWh Consumption
This is your most fundamental metric. You need to establish a clear "before" picture by measuring the energy consumption of the old lighting system. After the upgrade, you measure the "after" consumption. The difference is your raw energy savings. For a project to be credible, this data should come directly from utility meters or a calibrated monitoring system.
The Financial KPI: Total Dollar Savings
Once you have the kWh savings, you can translate it into the language everyone understands: money. Multiply the kWh saved by the cost per kWh from the utility bill. This gives you a hard dollar figure for your monthly and annual savings, which is the core of your ROI calculation.
The Scrutiny KPI: Photometric Equivalence
This is the expert-level KPI that defends your claims. You must prove that your new, lower-wattage LED system provides the same or better light levels (illuminance or luminance) and uniformity as the old system. If you don't, critics can argue that you saved energy simply by making the streets darker. Always design to a photometrically equivalent standard.
| Metric | Old HPS System | New Besenled LED System | The Winning Story |
|---|---|---|---|
| Power Draw | 400W per fixture | 150W per fixture | "We cut energy use by over 60%." |
| Illuminance | 10 lux (average) | 12 lux (average) | "And we actually improved light levels." |
| Uniformity | 0.4 (Poor) | 0.7 (Excellent) | "While eliminating dark spots." |
All 150W LED fixtures produce the same amount of light.False
Light output is measured in lumens, not watts. Efficacy (lumens per watt) varies widely. A high-quality 150W fixture from a supplier like Besenled might produce 21,000 lumens (140 lm/W), while a low-quality one might only produce 15,000 lumens (100 lm/W).
Designing to photometric equivalence ensures that energy savings claims are based on a fair, apples-to-apples comparison of lighting performance.True
This principle confirms that you are not saving energy simply by reducing light levels, which is critical for gaining approval from transportation and safety officials.
How Can You Measure Safety with Luminance, Glare, and Crash Ratios That Matter?
Everyone says "brighter is safer," but you can't prove it with feelings. Your safety arguments feel weak and subjective, making them easy to dismiss. Use objective lighting metrics and real-world data.
Focus on achieving proper luminance and uniformity3, especially at intersections and crosswalks where people and traffic mix. Minimize disabling glare by using fixtures with low BUG ratings. Then, correlate these lighting improvements with a reduction in nighttime vehicle and pedestrian crash rates in those specific zones.
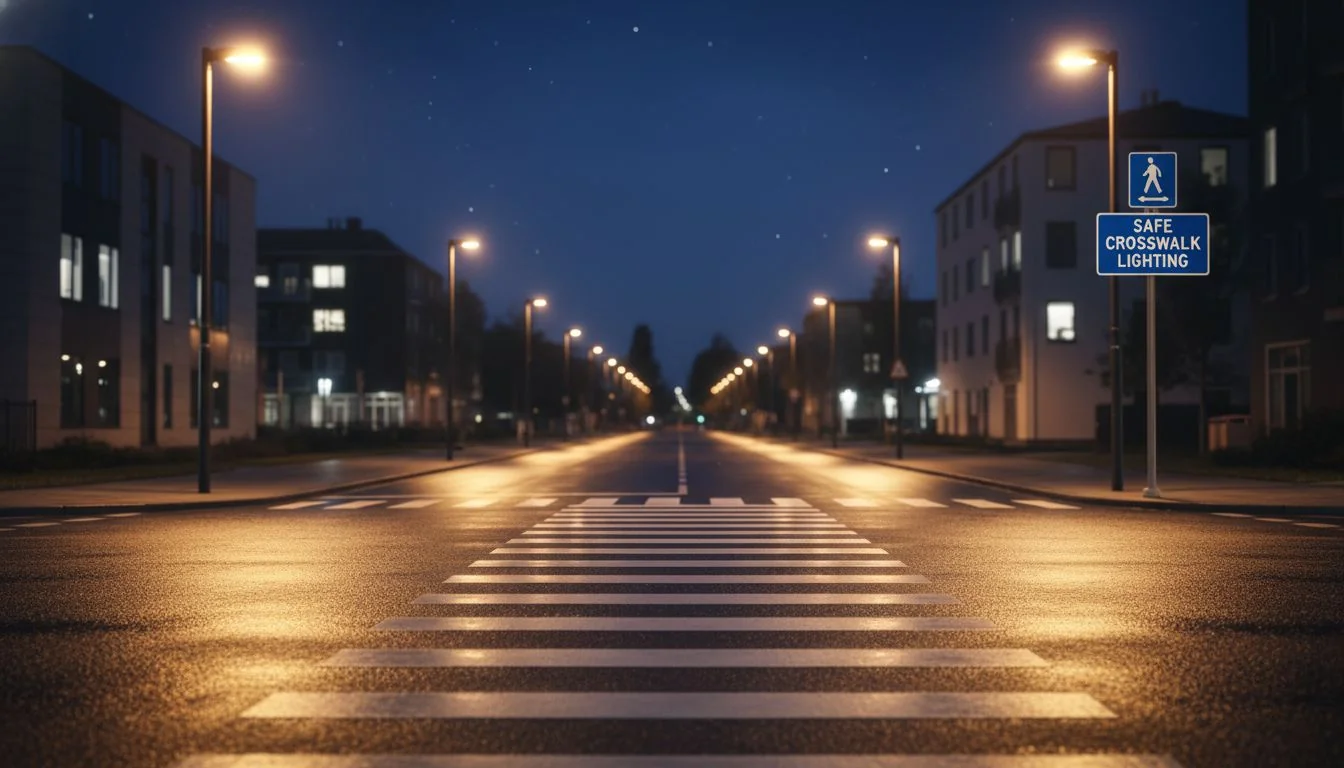
I've learned that the "brighter is safer" myth is dangerous. Over-lighting an area can create so much glare that it actually reduces a driver's ability to see a pedestrian in the shadows. The real sweet spot for safety ROI is not brightness, but visibility. That means focusing your investment on high-conflict areas like intersections and crosswalks. By improving the uniformity of light and controlling glare, you make hazards predictable and visible. This is a much more powerful safety story than just cranking up the brightness.
KPI 1: Luminance and Uniformity
Instead of just brightness, measure the average luminance (light reflected off the pavement) and, more importantly, the uniformity ratio. A good uniformity ratio (average-to-minimum) ensures there are no dangerous dark spots between poles. Target lighting investments where people and traffic mix, as this is where visibility matters most.
KPI 2: Glare Control (BUG Rating)
Glare is a safety killer. A fixture's BUG (Backlight, Uplight, and Glare) rating tells you how well it controls stray light. A lower "G" value means less glare. Your KPI should be to use fixtures with low glare ratings, especially in areas with pedestrians and oncoming traffic. Auditing hotspots for over-lighting and using proper shielding is a measurable safety improvement.
KPI 3: Crash Reduction Ratio
This is the ultimate safety KPI. Partner with local traffic authorities to get nighttime crash data for the project area before the upgrade. After one year, compare the data. A measurable reduction in the nighttime crash rate, particularly at intersections and crosswalks, is the most compelling proof that your project saved lives.
| Safety Metric | Before Upgrade | After Upgrade with Besenled | The Winning Story |
|---|---|---|---|
| Uniformity Ratio | 0.4 (High Contrast) | 0.7 (Smooth) | "We eliminated dangerous dark spots." |
| Glare Rating (G) | G3 (High Glare) | G1 (Low Glare) | "We improved visibility by cutting glare." |
| Nighttime Crashes | 12 per year | 7 per year | "The project led to a 41% drop in crashes." |
Street lighting has been proven to reduce nighttime crashes by over 30%.True
Multiple studies, including those summarized by the Federal Highway Administration (FHWA), show a strong correlation between the installation of new or improved lighting and a significant reduction in nighttime crash rates, particularly for pedestrians.
Higher color temperature (bluer) light is always better for safety.False
While some studies suggest cooler light can improve reaction times, it also contributes more to sky glow and can be more disruptive to human circadian rhythms and wildlife. A balanced approach, often around 3000K-4000K, is usually recommended.
How Do You Turn 311 Complaints and Outages into Performance KPIs?
Streetlight complaints are a constant headache for your public works department. You're always reacting to outages and angry calls instead of getting ahead of them. The solution is to track complaints, response times, and system resilience.
Monitor the number and type of monthly complaints to identify trends. Track your Mean Time To Repair (MTTR) to measure crew efficiency. Most importantly, use smart controls with remote fault alerts to proactively manage outages. This turns a reactive problem into a story of proactive performance.
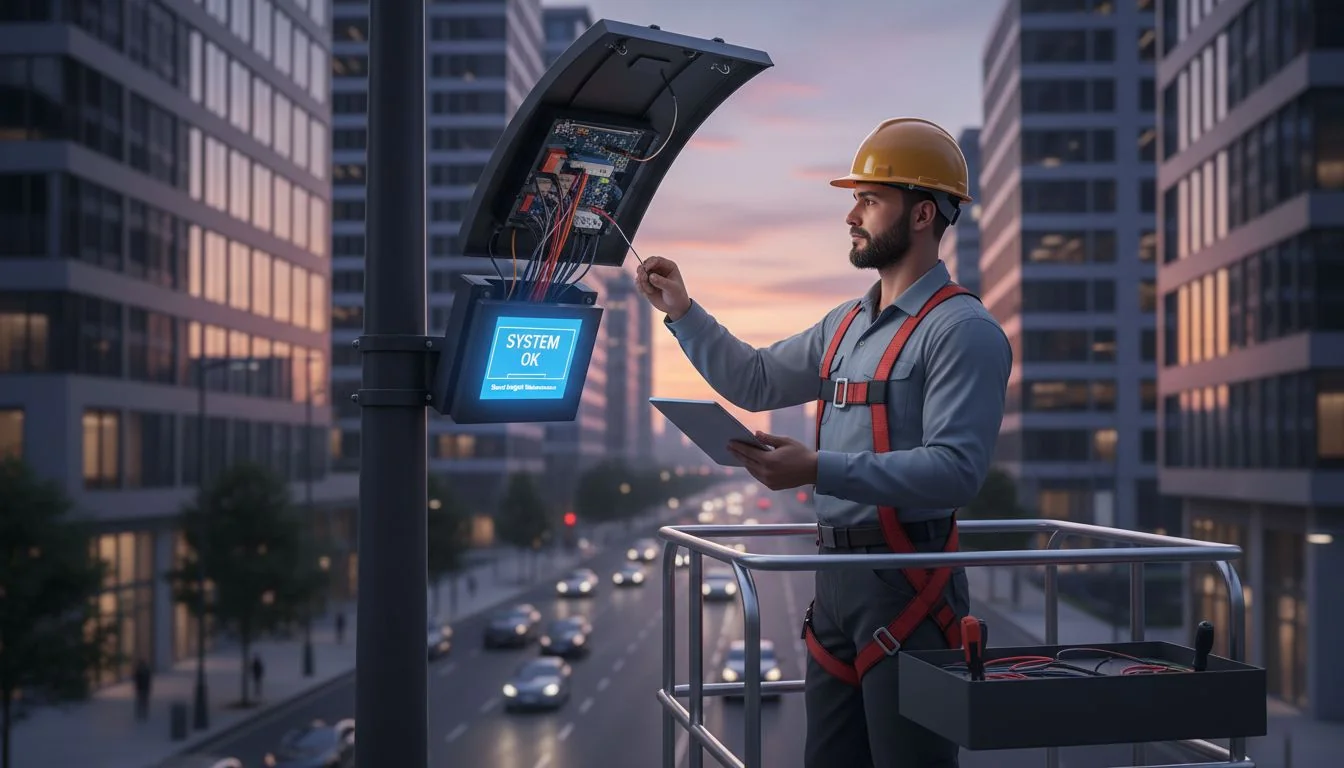
Nothing erodes public trust faster than a broken streetlight that stays broken for weeks. In the past, cities had to wait for a resident to call 311 to even know a light was out. Today, that's unacceptable. I always advise my clients to build resilience directly into their KPIs. This means using systems that send automatic fault alerts. It means having service level agreements (SLAs) for repairs. It even means practical things like theft-resistant wiring in high-risk areas. When you can report monthly that 99% of outages were detected automatically and fixed within 48 hours, you change the entire conversation from "the lights are broken" to "our system is reliable."
KPI 1: Complaint Volume and Resolution Rate
Stop treating 311 calls as just noise. Categorize and track them. Are they about outages, brightness, or something else? Your goal is to show a downward trend in complaint volume after the upgrade. Also, track your resolution rate: what percentage of complaints are closed within your target timeframe? Reporting this monthly shows accountability.
KPI 2: Mean Time To Repair (MTTR)
How long does it take from the moment a light fails to the moment it's fixed? This is your MTTR. With old systems, this could be weeks, because the "detection time" was so long. With a smart lighting system that sends instant alerts, you can slash MTTR from weeks to days or even hours. This is a powerful KPI for operational efficiency4.
KPI 3: System Resilience and Uptime
This is a proactive KPI. Instead of measuring failure, measure success. What is your system's uptime? 99.5%? 99.9%? This metric is powered by features like remote diagnostics, theft-resistant hardware, and backup power for critical corridors. It proves your network is not just new, but robust and resilient.
Smart streetlights can reduce maintenance costs by up to 50%.True
By eliminating the need for night patrols to spot outages and enabling efficient dispatch of repair crews with the right equipment, smart lighting systems drastically cut down on truck rolls and labor hours, which are major components of maintenance budgets.
A streetlight outage is a minor inconvenience.False
A single outage can create a pool of darkness that becomes a public safety hazard, increasing the risk of crime and accidents. It also erodes public confidence in municipal services.
What is the 'Right Light, Right Time' Playbook for Adaptive Controls?
You need to maximize energy savings, but you can't afford to compromise on public safety. A static, always-on lighting plan feels inefficient and outdated. The solution is to use adaptive controls5 for a dynamic lighting strategy.
Implement scheduled dimming during late-night, low-traffic hours (e.g., 30% brightness from 1 AM to 5 AM). At the same time, use motion sensors at crosswalks and intersections to return lights to 100% brightness instantly when a car or pedestrian is detected. This playbook satisfies both energy and safety goals.

The "right light, right time" concept is the pinnacle of smart street lighting. It ends the debate between the city's CFO, who wants to save money, and the police chief, who wants maximum light for safety. I've helped cities implement this playbook with great success. We start by analyzing traffic and pedestrian data to create a dimming schedule that makes sense. For example, lights are at 100% during the evening commute, dim to 70% after 10 PM, and then to 30% in the middle of the night. But the key is the safety net: motion sensors in critical zones. This hybrid approach delivers deep energy savings without ever leaving a citizen in the dark. It’s the ultimate win-win story.
The Strategy: Scheduled Dimming
This is your primary energy-saving tool. By creating a dimming profile based on typical activity levels, you can achieve significant additional energy savings on top of the initial LED conversion.
| Time Period | Activity Level | Light Level | Rationale |
|---|---|---|---|
| 6 PM - 10 PM | High | 100% | Evening commute, shopping, dining |
| 10 PM - 1 AM | Medium | 70% | Residential traffic, late-night activity |
| 1 AM - 5 AM | Very Low | 30% | Minimal traffic, maximum savings |
| 5 AM - 7 AM | Medium | 70% | Early morning commute |
The Safety Net: Motion-Activated Brightening
This is what makes deep dimming politically and practically acceptable. By placing sensors at intersections, crosswalks, and bus stops, you ensure that the light is always there when it's needed. The light level can ramp up to 100% in seconds, providing a safe environment on demand.
The Result: A Balanced KPI Scorecard
With this playbook, you can report on two seemingly conflicting KPIs simultaneously. You can show a 70-80% total energy reduction (from LED + controls) while also demonstrating 100% light availability in occupied zones, proving you have enhanced both efficiency and safety.
Adaptive lighting controls can provide an additional 30% in energy savings on top of an LED conversion.True
The U.S. Department of Energy and various case studies confirm that dimming, trimming, and other control strategies can significantly deepen the energy savings achieved by just swapping to LED.
Dimming streetlights makes neighborhoods less safe.False
When combined with motion sensors, dimmed streetlights maintain a baseline level of light and instantly brighten when activity is detected. This can actually enhance the perception of safety, as the responsive light signals presence and deters potential criminals.
Answering Your Top 5 Questions on Streetlight KPIs?
You still have lingering questions about streetlight performance. Misinformation and conflicting priorities make it hard to find clear, simple answers. Here are direct responses to your most common questions.
The fastest way to prove savings is with kWh reduction on the utility bill. Brighter isn't safer; good uniformity and low glare are safer. Strong evidence links quality lighting to fewer crashes. Smart controls improve safety perception by ensuring light is there when needed. And complaints are rising from old infrastructure, but smart monitoring is the solution.
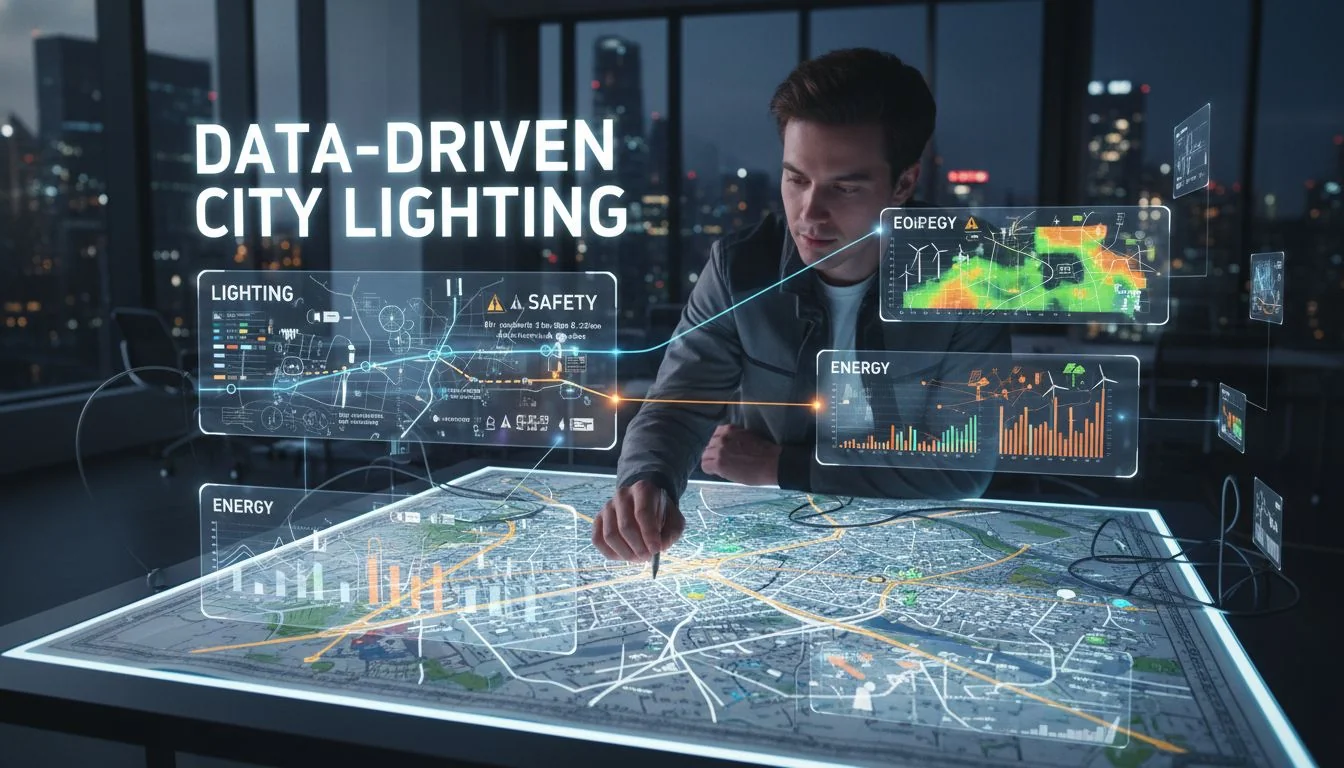
Over my 13 years in this business, these five questions come up on almost every project. Decision-makers want to be sure they are making the right choice, and they need clear, concise answers. They've heard conflicting stories and want to cut through the noise. My goal is always to provide them with the data to answer these questions for themselves. By focusing on measurable KPIs for energy, safety, and operations, you can provide definitive answers that build confidence and get projects across the finish line. Let's tackle each question directly.
What KPIs prove street-light energy savings quickly?
The fastest and most undeniable KPI is the monthly kilowatt-hour (kWh) consumption from the utility bill. Compare the bill from before the retrofit to the bill after. This, combined with the total cost savings (kWh saved x price per kWh), provides immediate, indisputable proof of financial return that any stakeholder can understand.
Do brighter LEDs actually improve safety?
No, not necessarily. The idea that "brighter is safer" is a myth. Safety comes from high uniformity (no dark spots) and low glare. An overly bright light can create disabling glare, making it harder for drivers to see pedestrians. The best safety KPI is a good uniformity ratio and a low BUG rating, not just high lumen output.
Is there strong evidence that street lighting reduces crashes?
Yes. The Federal Highway Administration (FHWA) and numerous independent studies confirm a strong link. The key KPI is the nighttime crash reduction rate. By comparing 1-2 years of pre-installation crash data to post-installation data in the upgraded corridors, you can show a statistically significant improvement, often in the range of a 30-40% reduction.
How do smart controls affect public safety perception?
Smart controls, like motion-sensing and adaptive dimming, often improve the perception of safety. Residents feel safer knowing that the lights will brighten to 100% as they walk or drive through an area. It creates a sense of a responsive, "living" environment, which can be more comforting than a statically lit street.
Why are streetlight complaints rising, and how do we reduce them?
Complaints are often rising due to aging infrastructure. Old HPS and metal halide lamps fail unpredictably. The best way to reduce them is with a smart LED system. The key KPIs to track are a reduction in complaint volume and a drastically lower Mean Time To Repair (MTTR), made possible by the remote fault-reporting capabilities of a smart network.
Conclusion
Mastering these KPIs for energy, safety, and operations transforms your lighting project. It moves from being a simple cost to a strategic, data-backed win for your community or development.
References
-
Understanding energy savings is crucial for justifying street lighting projects and ensuring financial viability. ↩
-
Understanding photometric equivalence ensures that energy savings claims are credible and based on actual performance. ↩
-
Luminance and uniformity are critical for ensuring visibility and safety in high-traffic areas. ↩
-
Operational efficiency metrics are essential for optimizing maintenance and reducing costs in street lighting. ↩
-
Adaptive controls can optimize energy use while enhancing safety, making them a smart investment for modern lighting systems. ↩