How Do You Prove a Street-Light Retrofit Was a Success with KPIs?
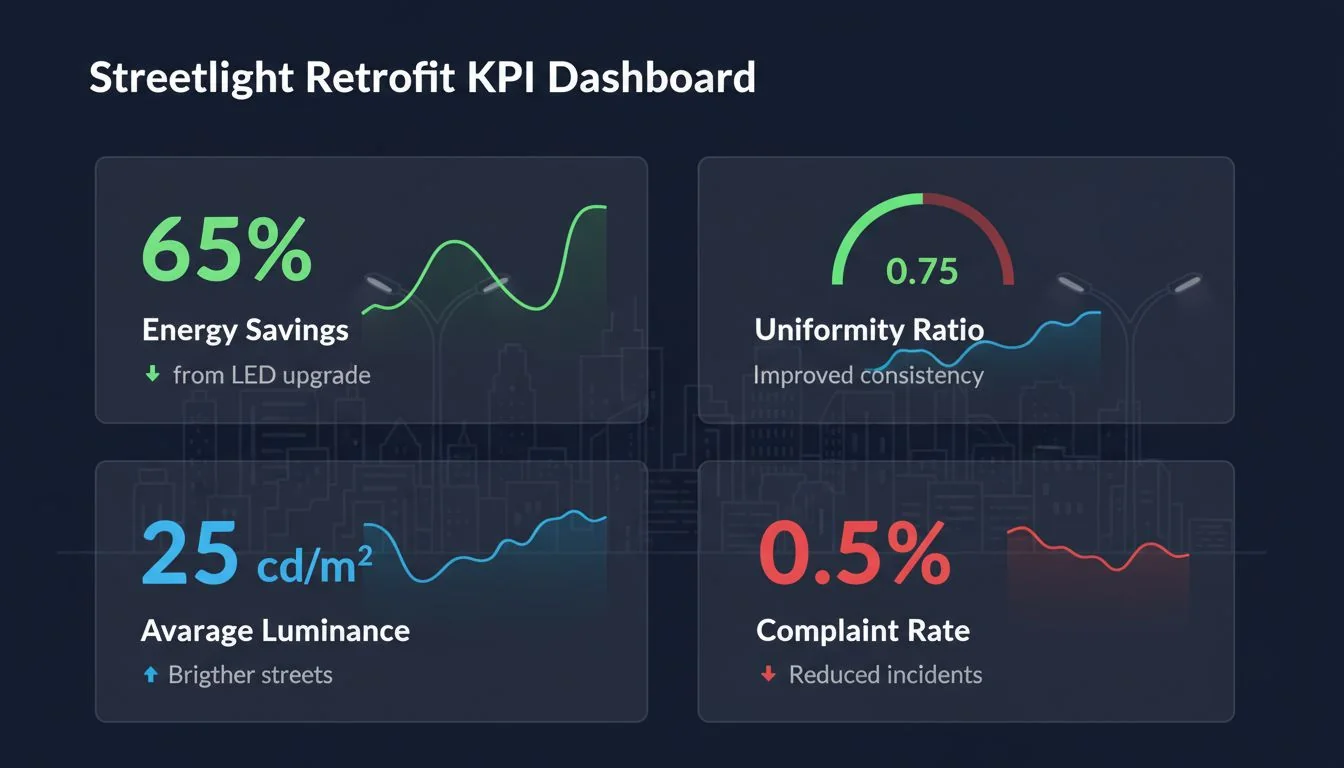
Your street-light retrofit is complete, but stakeholders want proof beyond a lower energy bill. You need to show the project improved safety and resident comfort, not just wattage.
Yes, you can prove it with four key performance indicators (KPIs). Track the before-and-after data for energy consumption (kWh), lighting uniformity (U0/U1), average luminance1 (Lv), and resident complaint rates. This creates a complete picture of success that satisfies engineers, city managers, and the public.

It's one thing to know what to measure, but it's another to actually do it right and understand the results. When I partner with developers and contractors, we set these KPIs as our acceptance gate from day one. No project is signed off until we hit our targets for both energy savings2 and visual quality. This approach avoids arguments later and ensures everyone agrees on what "success" looks like. Let's break down how we turn these numbers into real-world wins.
A successful LED retrofit only focuses on maximizing energy savings.False
A truly successful project must also improve visual quality, such as uniformity and glare control, and reduce resident complaints.
Using metered kWh data provides more accurate savings figures than relying on the manufacturer's nameplate wattage.True
Metered data from the utility or controller logs accounts for real-world operating hours, dimming schedules, and power factor, offering a true measure of energy reduction.
How Can You See All Your Project KPIs on One Screen?
Your project data is scattered across utility bills, photometric reports, and angry emails. You need a single source of truth to prove your retrofit worked.
Create a "Proof Panel" dashboard. This one screen should display four before-and-after metrics: metered energy savings (MWh/year), uniformity ratios (U0/U1), average luminance (Lv), and the total number of complaints. This gives stakeholders an instant, undeniable summary of the project's total impact.
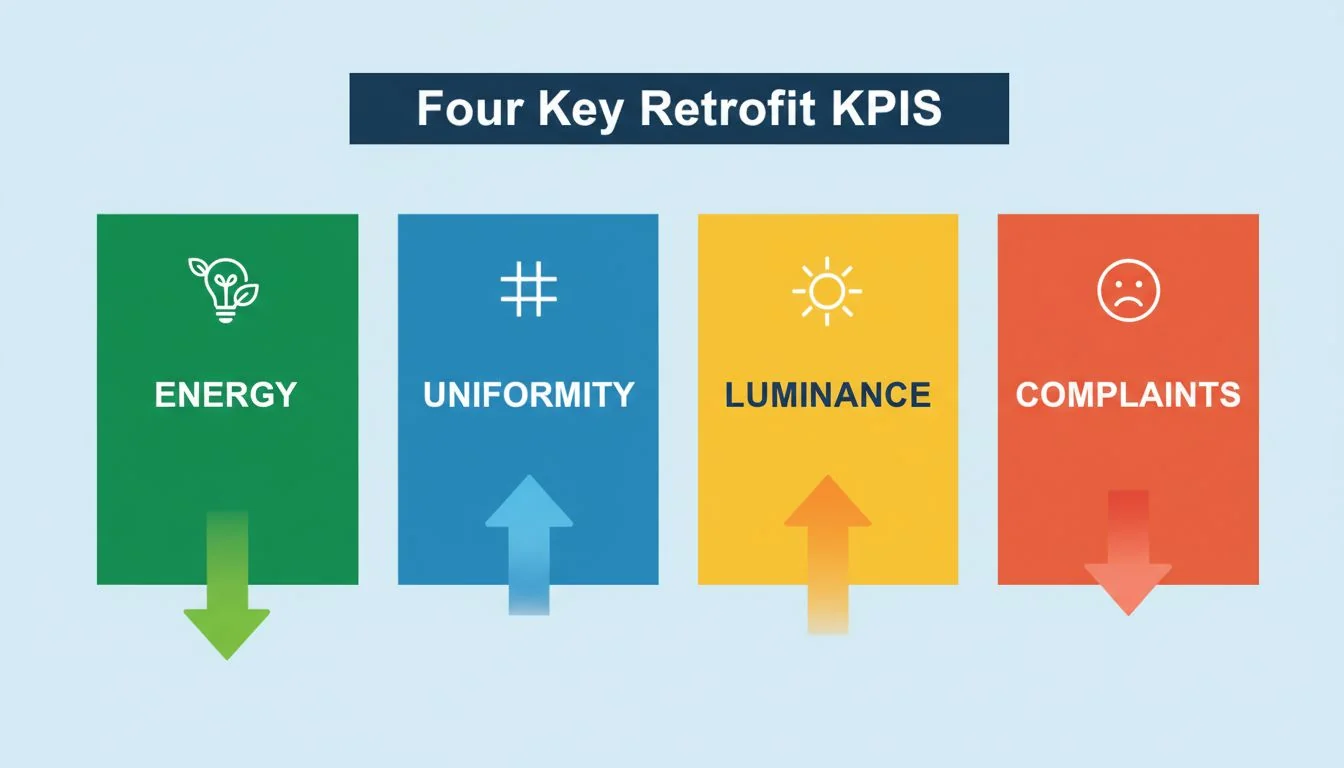
On a recent project, we used this exact method. The goal was clear: reduce energy use while improving visual comfort. We established a baseline for everything before we touched a single fixture. After the retrofit, which included our smart-controlled pole lights with custom optics, the dashboard told the whole story. We didn't just present a spreadsheet; we showed them a visual panel. It showed a 762 MWh/year saving, backed by controller log exports. It showed the uniformity (U0) improved from a patchy 0.15 to a smooth 0.42, meeting the RP-8 standard. And most importantly, the complaint heat map, which was once bright red with glare and trespass issues, had cooled to almost nothing. This is how you anchor your claims in reality.
The Four Pillars of Proof
A strong KPI dashboard3 is built on four pillars. Each one answers a different stakeholder's question.
| KPI | What It Measures | Who It's For | Why It Matters |
|---|---|---|---|
| Energy (kWh) | Actual energy consumed, from metered data or controller logs. | Financial Officer, City Manager | Proves ROI and budget savings. We cite scenario results, like "762 MWh/year saved," to set real expectations. |
| Uniformity (U0/U1) | The evenness of light on the road surface. U0 is overall, U1 is longitudinal. | Engineer, Public Works Director | Proves the lighting meets safety standards (like IES RP-84) and eliminates dark spots between poles. |
| Luminance (Lv) | The brightness of the road surface as seen by a driver. | Safety Officer, Residents | Proves you're providing enough light for visibility without over-illuminating and creating glare. |
| complaint rate5 | The number of resident complaints about glare, trespass, or color. | Mayor, Public Relations | Proves the new lighting improves quality of life and public acceptance. This is a direct measure of comfort. |
Nameplate wattage is the most reliable way to calculate energy savings.False
Real-world savings are determined by actual operating hours and dimming schedules, which are best captured by metered kWh or smart controller data logs.
Improving lighting uniformity (U0) can enhance a driver's ability to detect hazards between light poles.True
High uniformity creates a continuous visual field, eliminating dark patches where obstacles could be hidden, which is a key principle of IES RP-8.
How Do You Measure Light on a Real Road to Meet Standards?
You've installed new lights, but how do you prove they meet IES RP-8 or CIE standards? You can't just eyeball it; you need a repeatable, compliant measurement process.
You measure luminance (Lv) and calculate uniformity (U0/U1) using a grid-based method on the actual road. This involves a luminance meter, a defined grid of points between two poles, and calculations that align with RP-8 or CIE guidelines. This turns a subjective "looks good" into objective, defensible data.
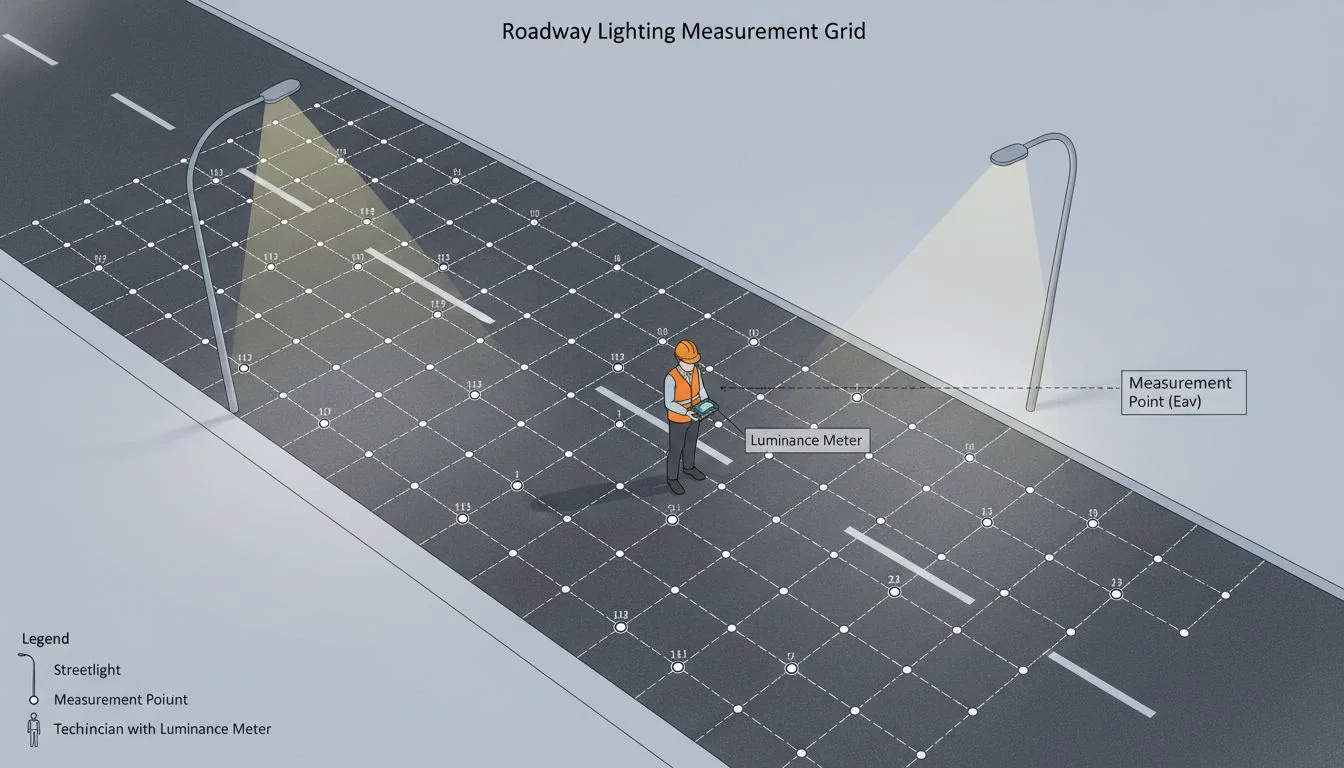
I remember a contractor who was struggling to get a project accepted. The city engineer said the lighting looked "patchy." The problem was, they had no data to prove otherwise. I showed them how to do it right. We took a luminance meter (like a Konica Minolta LS-150) and set up a measurement grid exactly as specified in IES RP-8. This means the grid spacing and observer position are standardized. We measured the luminance at each point on the grid. From that data, we calculated the average luminance (Lavg), the minimum (Lmin), and the maximum (Lmax). This allowed us to calculate the key uniformity ratios: U0 (Lmin/Lavg) and U1 (Lmin/Lmax along the centerline). The data proved the new installation met the required R3 road classification targets. The project was accepted the next day.
From Field Data to Standard Compliance
Turning raw field measurements into proof of compliance is a clear, step-by-step process. It removes all guesswork.
- Define the Calculation Area: This is the area between two consecutive light poles in a single lane.
- Establish the Grid: For RP-8, the grid typically has 10 points longitudinally (along the road) and at least 2 points transversely (across the lane). The exact spacing depends on the mounting height and pole spacing.
- Set the Observer Position: The measurements must be taken from the perspective of a driver. RP-8 specifies an observer height of 1.45m and a longitudinal distance of 83m from the measurement points.
- Measure and Record: Use a calibrated luminance meter to record the cd/m² value at each grid point.
- Calculate the KPIs:
- Average Luminance (Lavg): The average of all grid point readings.
- Overall Uniformity (U0): The ratio of the minimum luminance to the average luminance (Lmin / Lavg).
- Longitudinal Uniformity (U1): The ratio of the minimum to the maximum luminance along the lane's centerline.
This process gives you the hard numbers needed to sign off on a project with confidence.
Visual inspection is sufficient for determining if a roadway meets IES RP-8 lighting standards.False
Compliance requires quantitative measurements of luminance and illuminance at specific grid points, as visual perception is subjective and cannot verify numerical thresholds.
A higher U0 uniformity ratio (e.g., 0.4 vs. 0.2) indicates more even lighting on the road surface.True
U0 is the ratio of minimum to average luminance. A higher value means the minimum brightness is closer to the average, resulting in fewer dark spots and a more uniform appearance.
How Do You Reduce Glare and Complaints from New Streetlights?
You upgraded to efficient LEDs, but now residents are complaining about harsh glare and light spilling into their windows. How do you fix this without sacrificing safety?
Prioritize visual comfort from the start. Use warmer color temperatures (CCT), proper shielding, and advanced optics. These three elements work together to cut glare, reduce light trespass, and dramatically lower complaint rates, especially in residential areas. A little less efficiency for a lot more comfort is always a winning trade.

My first rule for any residential retrofit is to walk the street at night before we even start modeling. I log every hotspot of glare and light trespass myself. On one project, I saw light from an old HPS cobra-head shining directly into a second-story bedroom. During the design phase with my team at Besenled, we used that specific location as a test case. We specified a 3000K CCT pole light with a house-side shield and Type III optics. After installation, I went back to that same spot. The street was perfectly lit, but the window was dark. Making the problem tangible to residents by showing you've listened and fixed their specific issue is more powerful than any photometric report.
The Comfort-First Design Toolkit
When we design a lighting plan, we focus on more than just lumens per watt. We focus on the human experience.
- Warmer Color Temperature (CCT): In residential zones, we cap CCT at 3000K, and often recommend 2700K. Cooler, blue-rich light (4000K+) is perceived as harsher and is more disruptive to human sleep cycles. While a 5000K fixture might be slightly more efficient in terms of lm/W, the increase in complaints is never worth the marginal energy gain.
- Shielding and Optics: This is about putting light only where it's needed.
- BUG ratings6: We use fixtures with low BUG (Backlight, Uplight, Glare) ratings. A low 'B' rating prevents light from spilling behind the pole onto private property (trespass). A low 'U' rating prevents skyglow. A low 'G' rating controls high-angle glare that affects drivers and pedestrians.
- House-Side Shields: This is a simple but incredibly effective accessory. It's a physical barrier on the back of the luminaire that creates a sharp cutoff, protecting homes from unwanted light.
- Custom Optics: Modern LED optics can shape light with incredible precision. We can use different distributions (e.g., Type II, III, IV) to match the geometry of the road and avoid wasting light.
Higher CCT (e.g., 5000K) is always better for street lighting because it is more energy-efficient.False
While cooler CCTs can offer slightly higher lumens per watt, they often lead to increased complaints about glare and sleep disruption. Warmer CCTs (≤3000K) are preferred for residential comfort.
Fixtures with low BUG ratings help reduce light pollution and light trespass.True
The BUG rating system quantifies how much light is directed in undesirable directions. Low ratings for Backlight, Uplight, and Glare ensure light is focused on the target area, improving comfort and environmental friendliness.
Is More Light on the Road Always Safer?
There's a common belief that to make a road safer, you just need to make it brighter. But this often leads to over-illumination, which wastes energy and can even create new safety problems.
No, more light is not always safer. Safety is about visibility, which is determined by contrast, not just brightness. You only need enough light to meet obstacle detection thresholds. Exceeding this is not only wasteful but can also create disabling glare, reducing a driver's ability to see clearly.
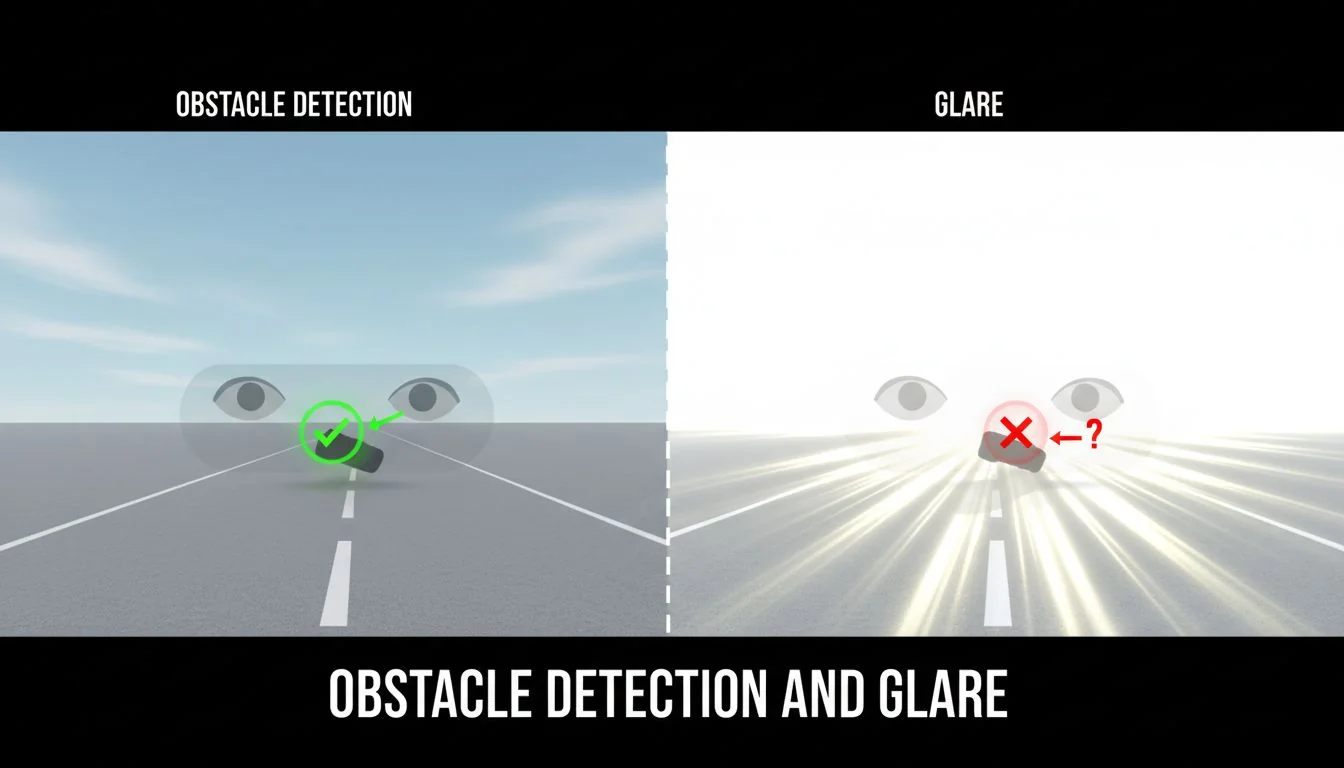
I often have to make the case against over-illumination to clients who are used to the old "more is better" mindset of HID lighting. The key is to talk about obstacle detection. The human eye doesn't need a huge amount of light to see a potential hazard, like a small animal or debris on the road. What it needs is sufficient contrast between the object and its background. According to research that informs standards like RP-8, these detection thresholds are often met with surprisingly low light levels, provided the light is uniform. By designing to meet, but not excessively exceed, these thresholds, we deliver a system that is both safe and highly efficient. We use smart controls to dim the lights during low-traffic hours, saving even more energy while still maintaining safe visibility levels.
Finding the Sweet Spot: Enough, Not More
The goal is to balance safety, efficiency, and comfort. Over-lighting fails on all three counts.
- The Science of Seeing: Visibility is primarily about contrast sensitivity. Your eyes adapt to the brightest thing in your field of view. If the road is excessively bright, your pupils constrict. This makes it harder to see into the darker areas at the side of the road or to spot a dimly lit object.
- Disability Glare: Over-illumination is a primary cause of disability glare. This is the "veil of light" that reduces contrast and makes it difficult to see. It's a common problem with poorly designed LED retrofits that simply tried to match the lumen output of old HPS lamps.
- adaptive controls7: The best way to provide "enough light" is with an adaptive system. We can program our smart streetlights to operate at 100% during peak evening hours, then dim down to 50% or 30% after midnight when traffic is minimal. This saves a huge amount of energy—often an additional 30-50% beyond the initial LED savings—without ever compromising the core requirement of obstacle detection. This is the smartest way to manage a public lighting network.
Doubling the luminance on a road automatically doubles a driver's ability to see hazards.False
Visibility is based on contrast, not just brightness. Beyond a certain point, increasing luminance yields diminishing returns for safety and can introduce disabling glare, which reduces visibility.
Adaptive lighting controls can save an additional 30-50% in energy costs on top of the savings from an LED conversion.True
By dimming lights during low-traffic periods (e.g., after midnight), adaptive controls reduce energy consumption significantly while still maintaining safe, pre-defined light levels.
What Are the Key Questions to Ask About Your Retrofit?
You're planning a retrofit and need quick, clear answers to the most common questions. How do you navigate the technical details and make the right choices?
Here are the answers to the top five questions we get from project managers and developers. These insights will help you define your project goals and specify the right solution.
These questions come up on almost every project call. Having clear, data-backed answers is part of our job as a lighting partner. It's not just about selling a fixture; it's about providing the expertise to ensure the project succeeds on every level—financially, technically, and for the community. For example, when someone asks about acceptable uniformity, the answer isn't a single number. It depends on the road's classification, from a busy highway (R1) to a quiet residential street (R4). We help our clients navigate these standards to choose the right target for their specific application, ensuring they don't over-specify and over-spend.
Your Retrofit FAQ Answered
-
What are acceptable roadway uniformity ratios?
It depends on the road classification in IES RP-8. For a typical collector road (R3), you'll aim for an average luminance uniformity (U0) of 0.4 or better. For major highways (R1), the requirement is stricter, while for local residential streets (R4), it can be more relaxed. -
How much energy can adaptive controls save beyond LEDs?
A lot. While switching to LEDs can save 50-60%, adding adaptive controls (like scheduled dimming) can save an additional 30-50% on top of that. By dimming lights during off-peak hours (e.g., 1 AM to 5 AM), you cut energy use without compromising safety. -
Does more light always mean safer?
No. Safety comes from good uniformity and contrast, not just high brightness. Too much light creates glare, which reduces visibility. The goal is to meet the minimum light levels required by standards like RP-8, not to exceed them wastefully. -
How do I reduce glare and complaints post-retrofit?
The best fix is prevention. Specify fixtures with warmer CCT (3000K or less), excellent optics (low BUG ratings), and use house-side shields in residential areas. If you're fixing a problem post-retrofit, adding shields and adjusting dimming levels are your most effective tools. -
Which metrics prove glare reduction?
The 'G' in the BUG rating is the primary pre-installation metric. Post-installation, you can measure Veiling Luminance (Lv) to quantify disability glare. However, the most powerful metric is often qualitative: a sharp drop in the number of resident complaints.
A uniformity ratio (U0) of 0.1 is acceptable for all types of roads.False
Acceptable uniformity ratios vary by road type. A U0 of 0.1 is very poor and would not meet the standards for most roads, which typically require 0.3 or 0.4 to ensure safety.
A drop in resident complaints is a valid KPI for measuring the success of a lighting retrofit's visual comfort.True
Complaint rates are a direct measure of public acceptance and perceived quality, reflecting issues like glare, light trespass, and color temperature that photometric reports alone cannot capture.
Conclusion
Ultimately, proving a retrofit's success requires a balanced scorecard. Use metered energy, compliant uniformity, appropriate luminance, and reduced complaint rates to build an undeniable case for your project's value.
References
-
Average luminance is essential for visibility; learning more can enhance safety standards in urban areas. ↩
-
Understanding energy savings can help stakeholders appreciate the financial and environmental benefits of retrofitting street lights. ↩
-
A well-designed KPI dashboard can effectively communicate project success to stakeholders, making it worth investigating. ↩
-
Familiarity with IES RP-8 standards ensures compliance and safety in street lighting projects, making it crucial to explore. ↩
-
Lower complaint rates indicate better public acceptance, making it vital to explore strategies for improvement. ↩
-
BUG ratings are vital for minimizing light pollution and enhancing comfort, making them an important topic for further research. ↩
-
Adaptive controls can significantly reduce energy costs while maintaining safety, making them a key area for exploration. ↩